
The Upcoming Week 11/9/25

Stimulus checks, 50 year mortgages, and rate cuts. Oh my.
I think we’re setting up for a nice year end rally but this past week was a rollercoaster.
If you were reading commentary on X or watching CNBC you’d think we were potentially entering a bear market. The destruction of high beta momentum stocks made the recent pullback feel like armageddon, in the big picture this was a very routine and normal correction. The Nasdaq pulled back 5% and the S&P500 even less. Why did it feel much more severe? Underneath the hood, momentum stocks took it on the chin and ETFs that track high beta growth such as Ark pulled back more than 10%. What I call this is a stealth correction, where many momentum stocks reset as the indices continue to hold up just fine. Here’s a look at how a few of the popular high beta momentum stocks have performed since their latest peak:
ONDS -54%
RR -51%
OKLO -45%
BMNR -39%
HIMS -39%
ASTS -35%
It’s okay to have a stealth correction which resets a bunch of the high beta momentum while the overall market still “looks” healthy. This is normal and after this correction is done, it looks like we could be setting up an end of year push as we head into the holiday season.
In this newsletter I’ll be sharing my thoughts on the overall market, a recap of the past week, what to watch in the week ahead, the overlooked AI energy theme that few are talking about, my favorite under the radar small cap play in that theme, a new stock with Trump family ties, some weekly charts that are setting up, and more.
Let’s start with a look at a few of the indices and ETFs:
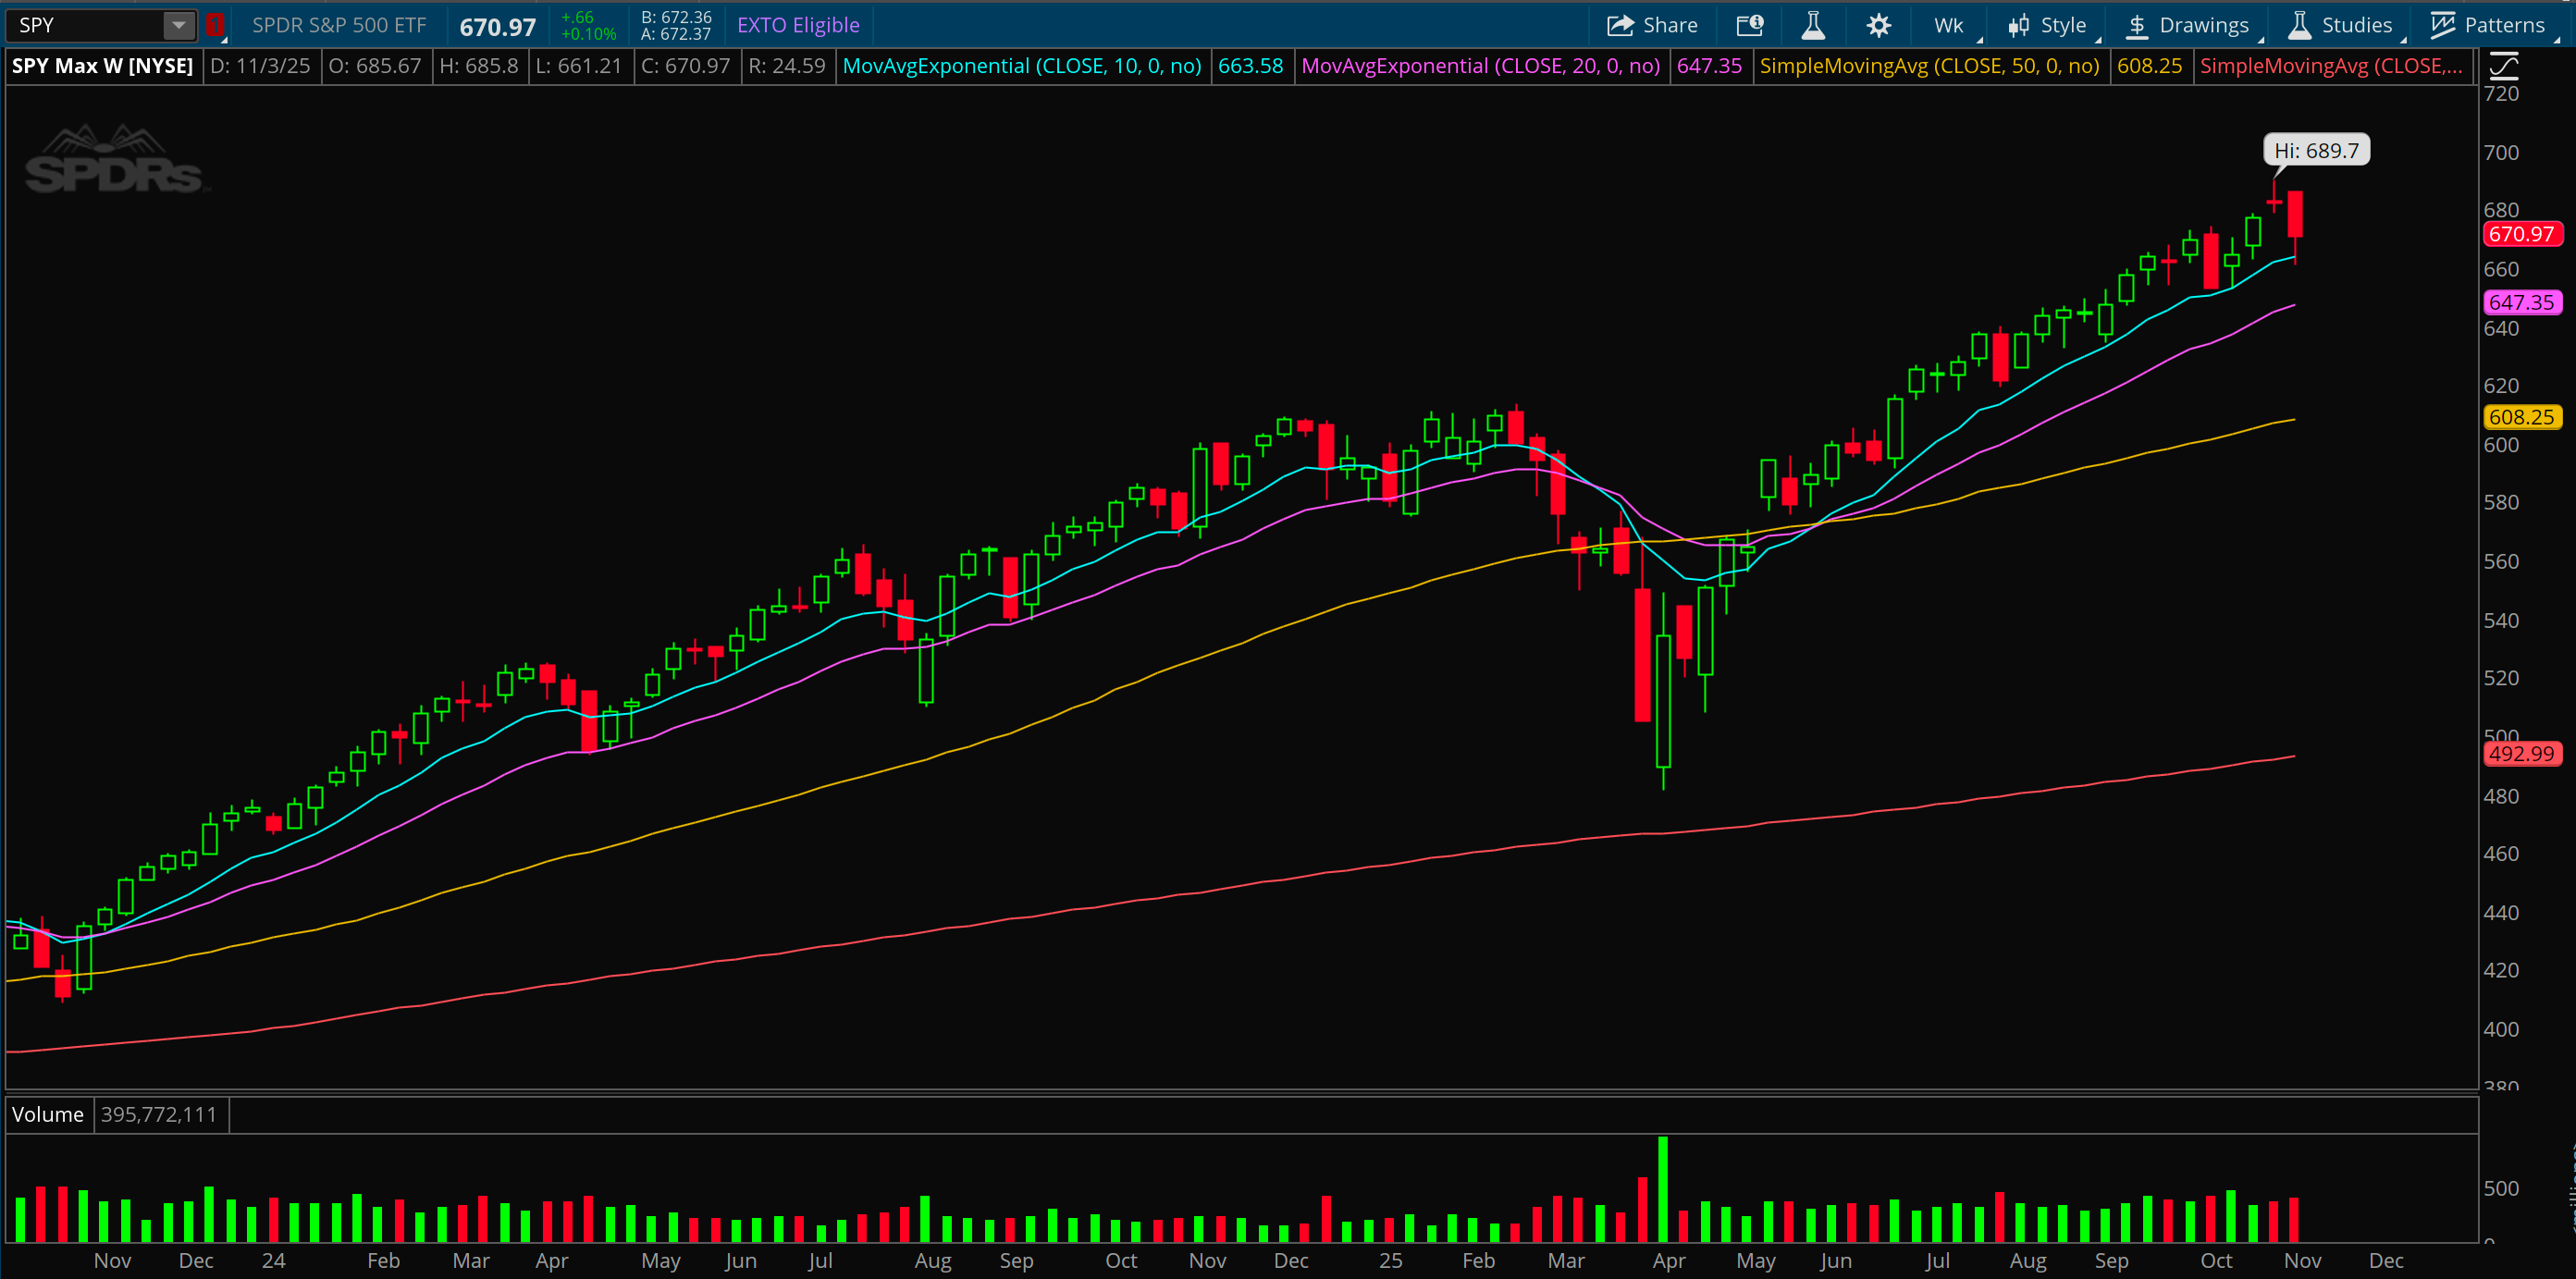
SPY:
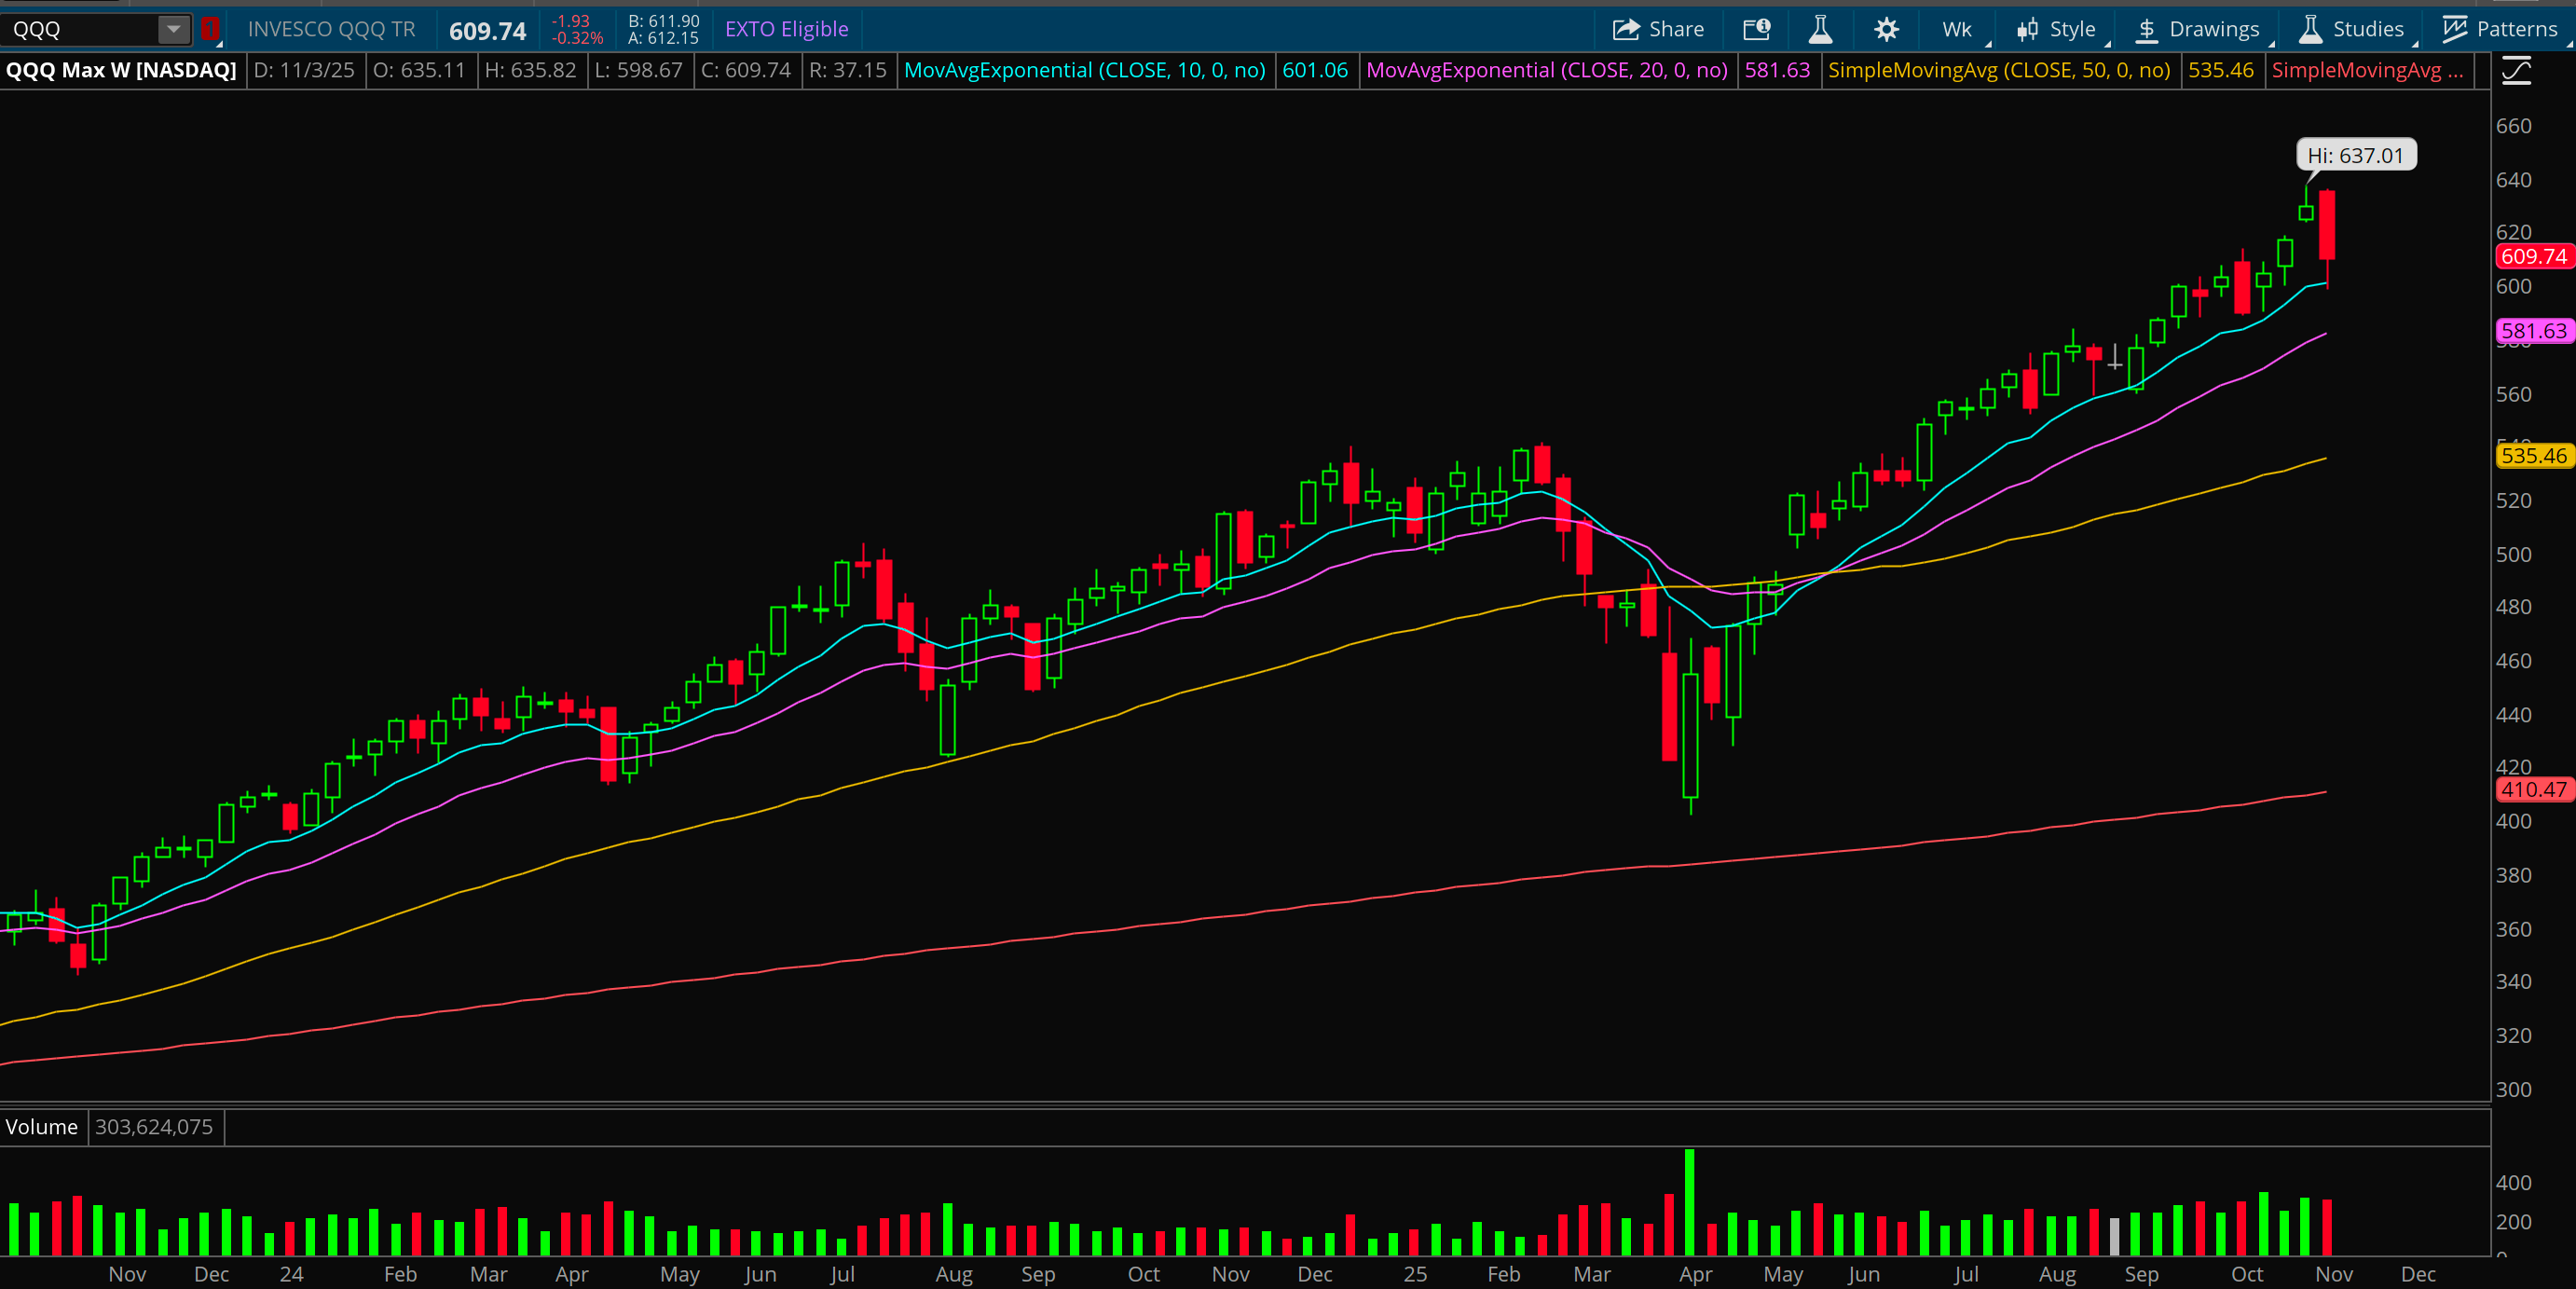
QQQ:
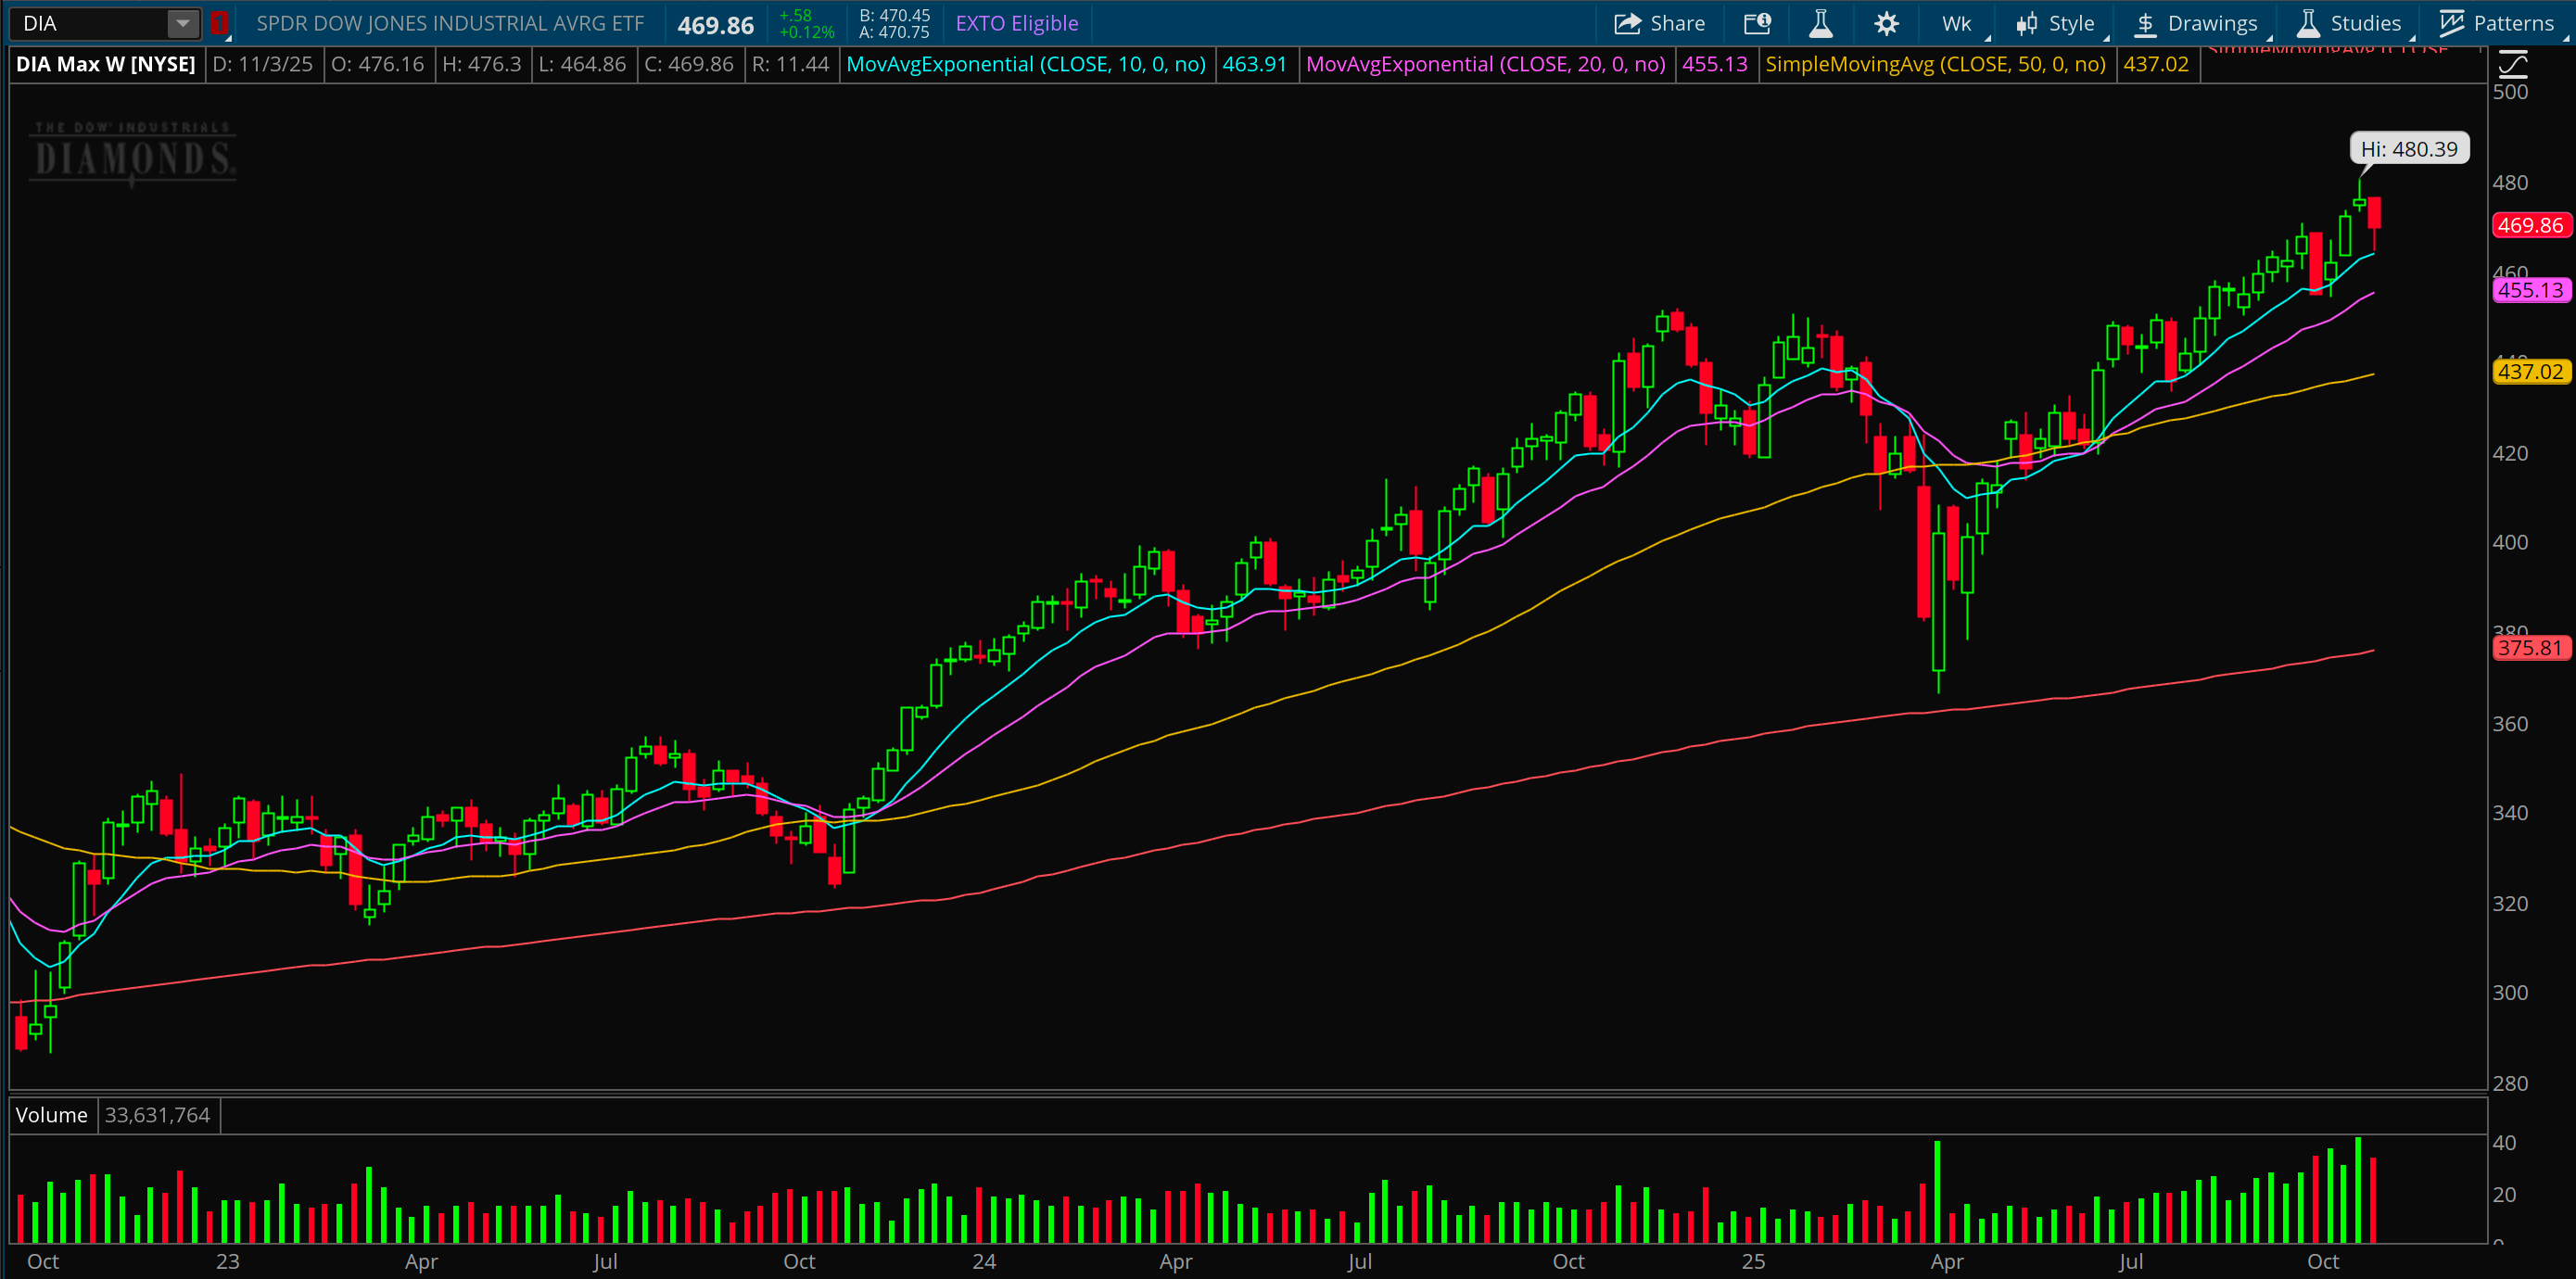
DIA:
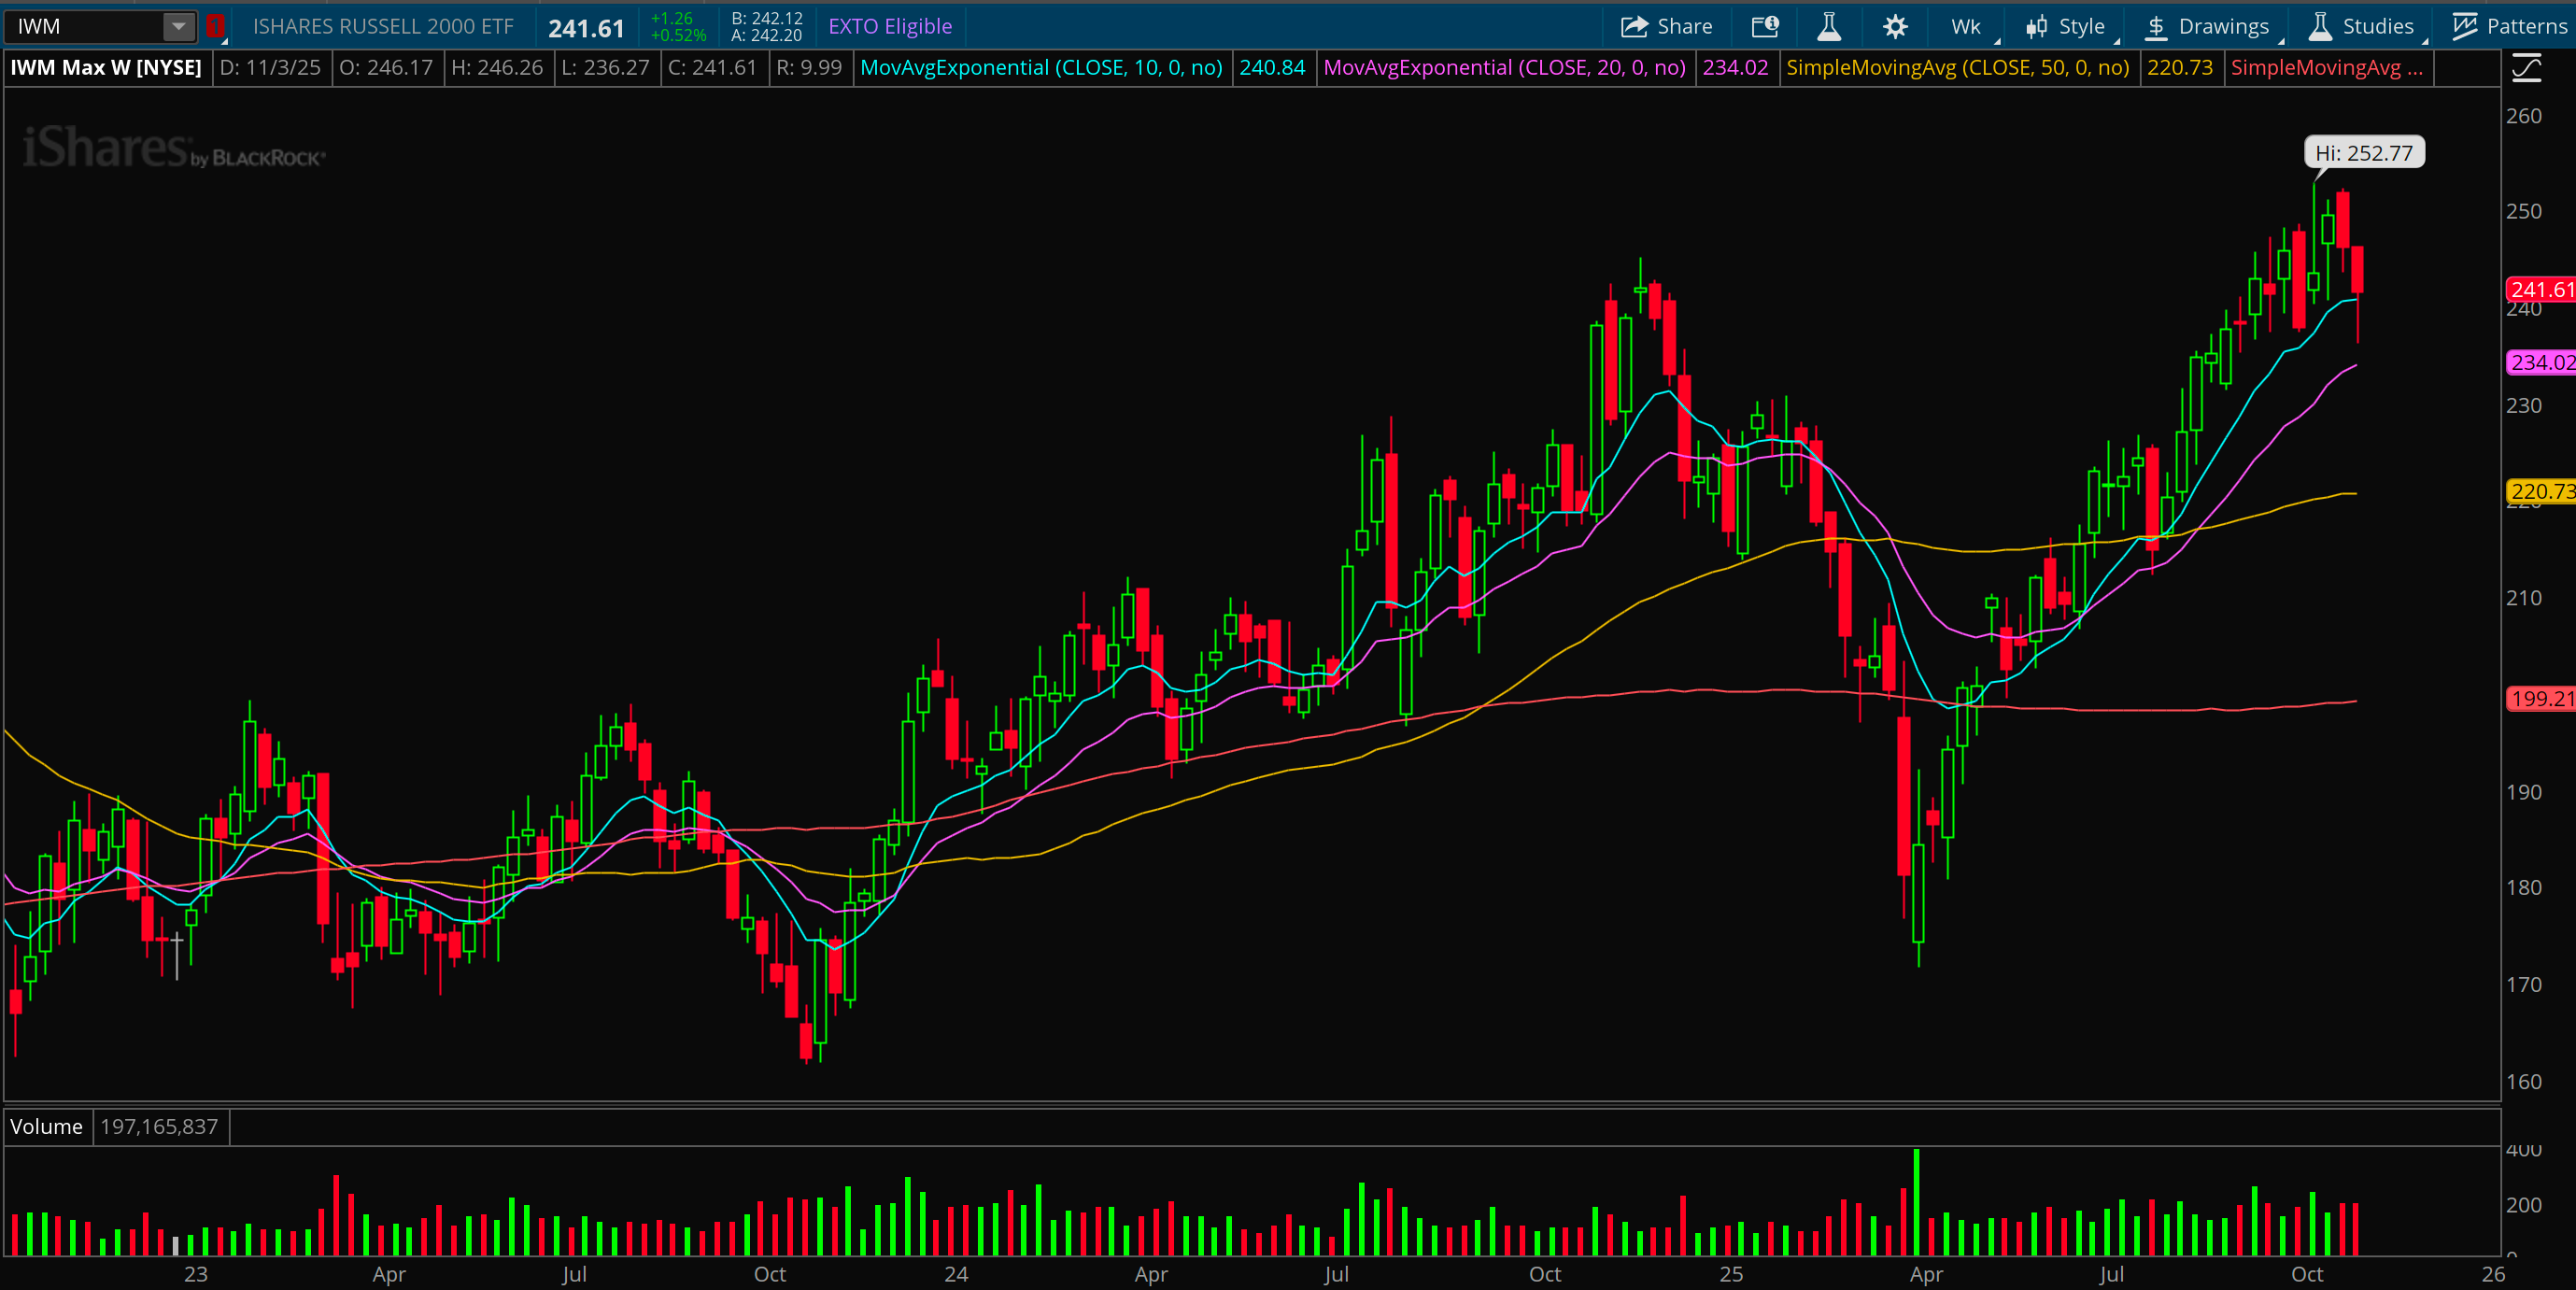
IWM:
ARKK:
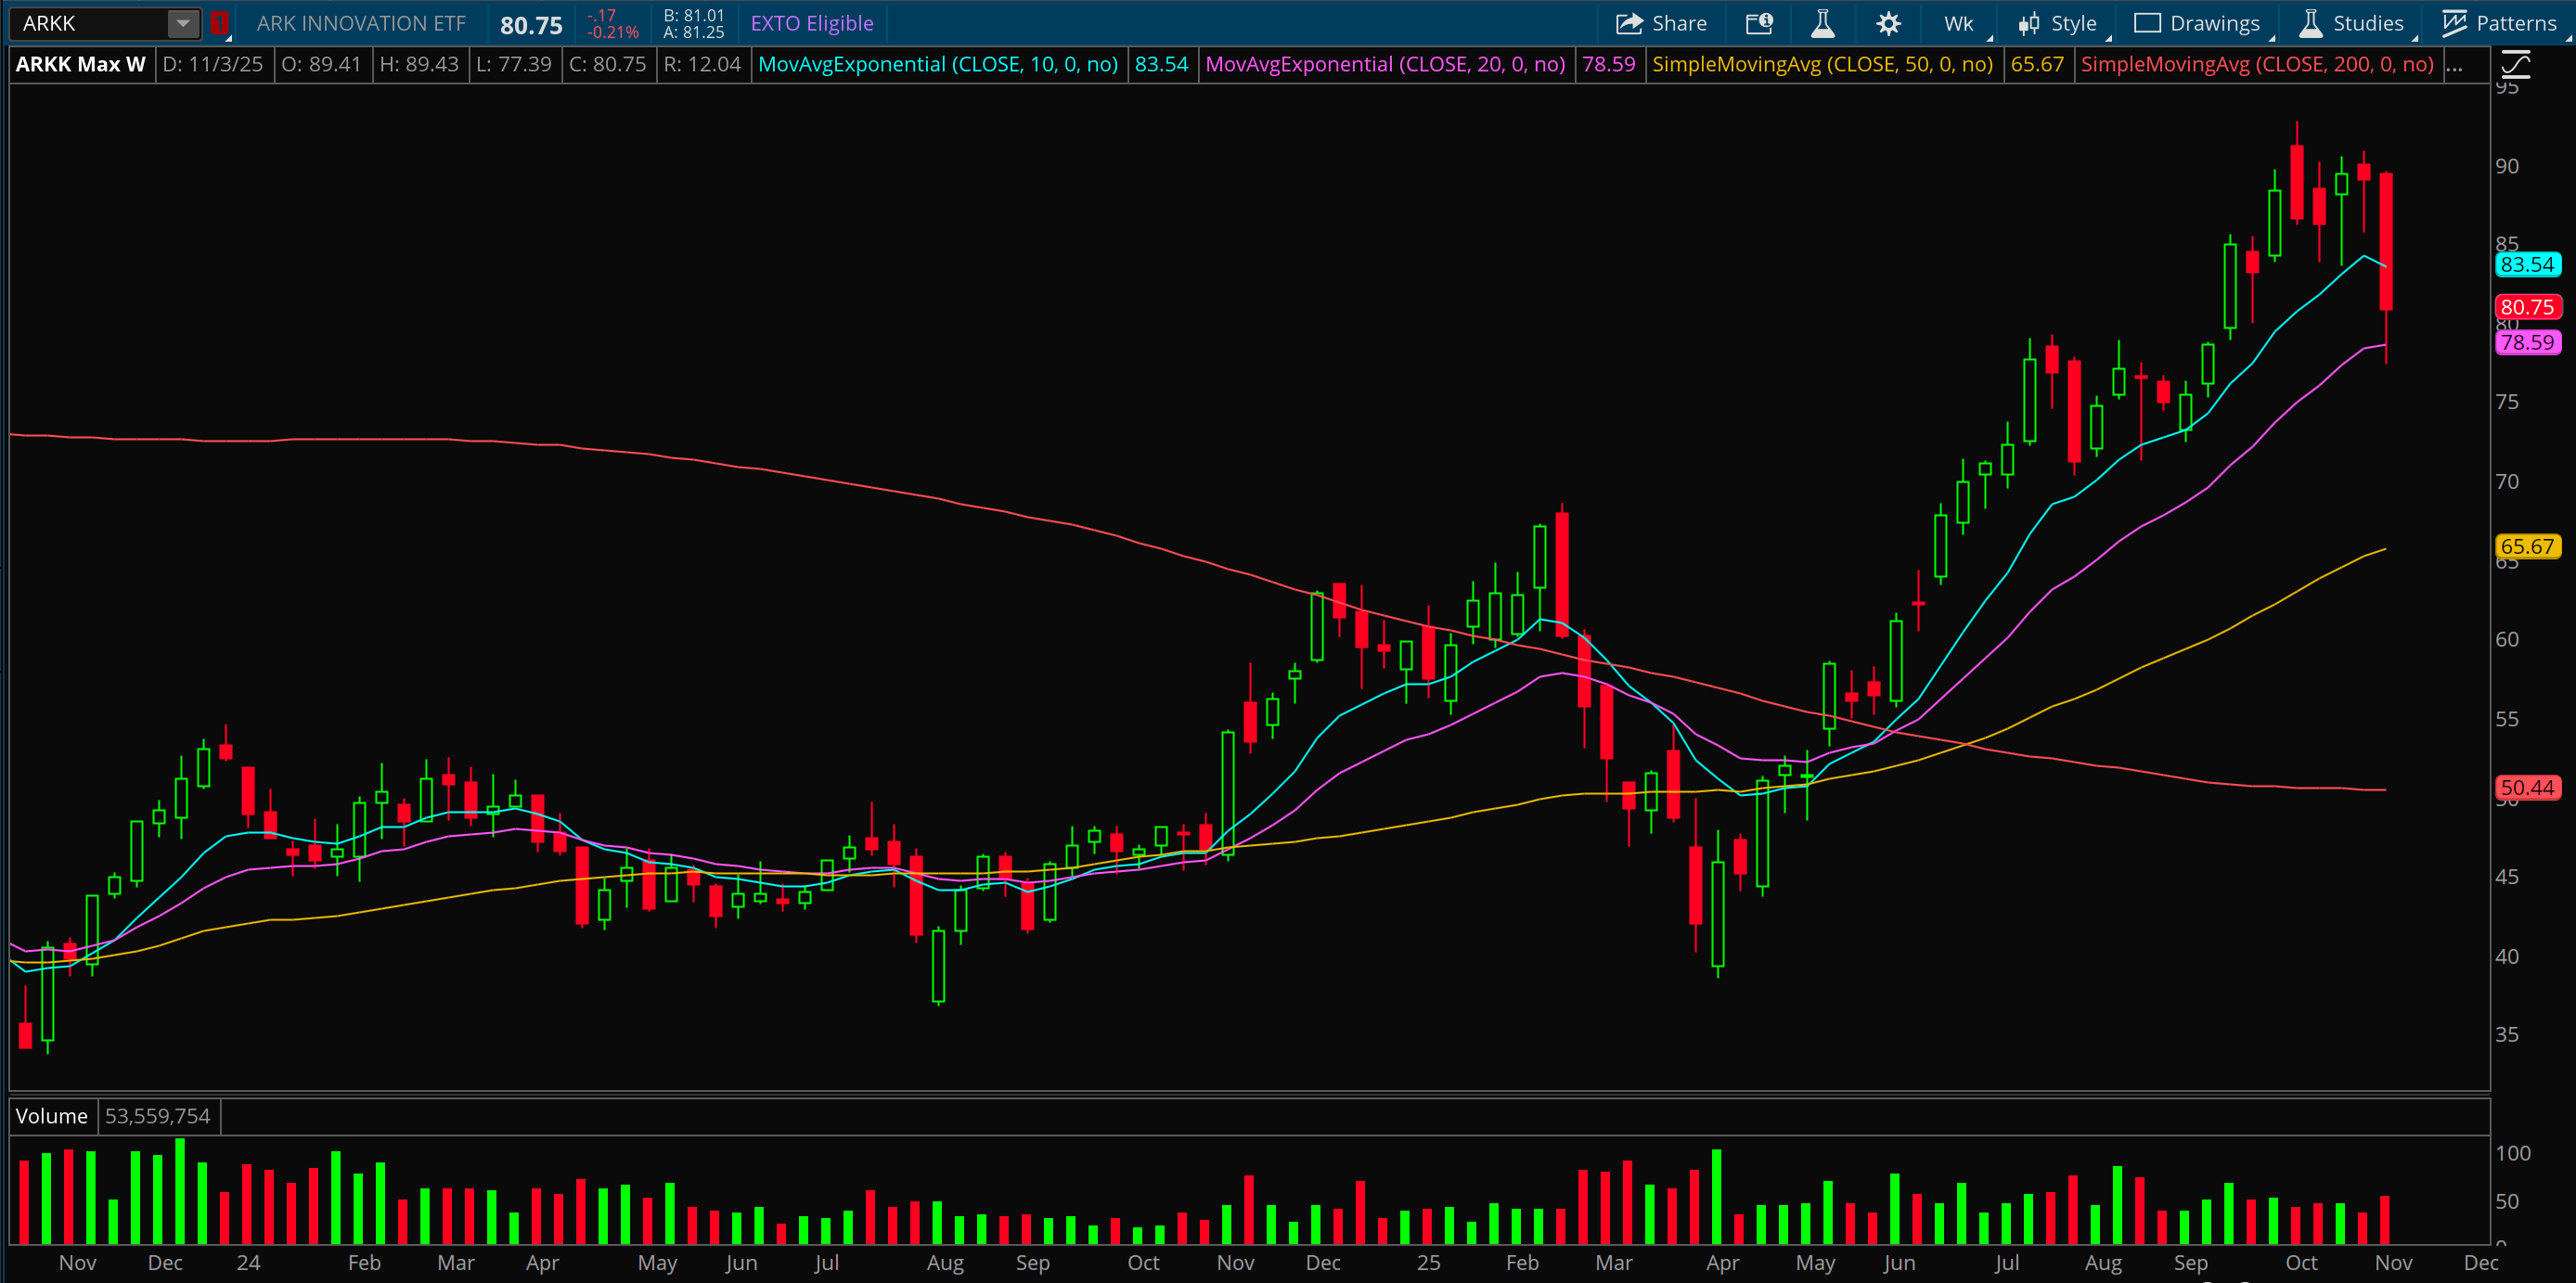
Last week I mentioned that I didn’t love the fact that we saw a doji candle on the S&P500 and this week we saw a 3% drop. The structure of these indices is still fine, I’m not seeing any reason to panic yet. The Nasdaq and S&P500 did not break any major levels or moving averages. I’d say that this past week or so was more of a warning shot to those who are levered in the high beta risk names vs. a warning shot to the market. As you can see, Ark had the most substantial decline of all as it’s the fund most correlated to growth. Notice it bounced right off the 20 week moving average and previous support around $78-$80, this isn’t a broken chart yet. I will note that Ark closed below the 10 week moving average for the first time since this advance off the April low began, but it’s still not a reason to sell everything and go into hiding. Could it get there? Yes. Is it time to be a bit more nimble? Also yes. If we see a close below the 20 week moving average on Ark, then I’d be more inclined to think we might see more intense selling across growth. For now, I am still of the mindset that this market will continue it’s macro trek higher with dips, corrections, and consolidations along the way. The big picture pain trade is up.